by John P. Pratt
23 Oct 2018, 1 Mid Autumn (Enoch)
©2018 by John P. Pratt. All rights Reserved.
| 1. The Method |
| 2. Modern Map |
| 3. Medieval Map |
| 4. Dendera Planisphere |
| 5. Conclusion |
| Notes |
This article began as an exercise for the students in my online sacred calendar tutorial class. It then became clear that it is possible that the exercise might have been the first attempt to date certain maps in this manner, which has been given the name of "colure averaging". This article is not intended for the general reader, but for those interested in better understanding the meanings of the equinoxes and solstices and their precession throughout history.
The method is basically simply to average, if possible, four results derived from estimates from using both equinoxes and both solstices. The word "colure" refers in this article to either an equinox or solstice point on the ecliptic.[1] The technique is to estimate the date indicated by the stellar positions, not the date of the actual production of the map itself. For example, the first medieval star maps were made by using the measurements made in ancient Greece. The method is applied both to medieval star maps as well as the Planisphere of Dendera, Egypt. Hopefully with this technique the reader will learn to approximately date many star maps quickly.
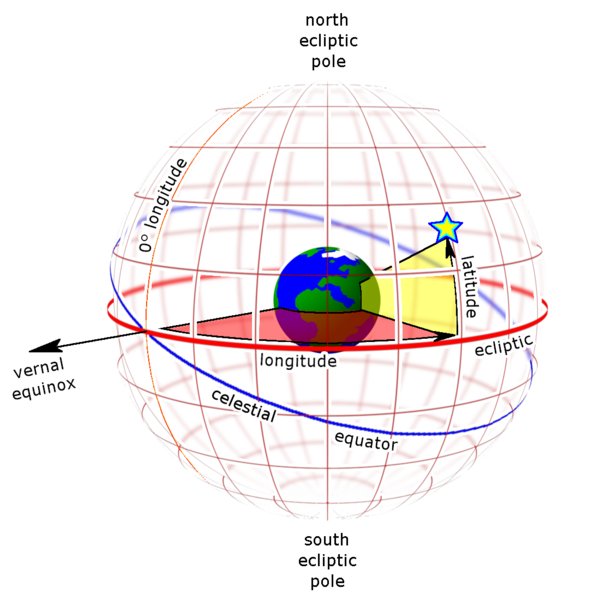
The colure averaging dating method is very simple. Most star maps have two great circles drawn on them: the celestial equator and the ecliptic. The latter is named for the fact that solar and lunar eclipses occur on that circle. These two circles intersect at two points called the vernal and autumnal equinoxes. There are also two points where points on the two circles are the most separated called the summer and winter solstices. Those points occur halfway between the equinox points. Even if these circles are not drawn they are often both implied.
|
 |
In order to date the maps, a comparison scale is needed. There are four possible scales, one for each of the equinoxes and solstices, that is, one for each of the four colures. The method of using only the spring equinox is not new and is often taught in basic astronomy courses. The main innovation introduced in this article is simply to average the results of all four colure measurements, when possible, to obtain better accuracy.
Let us first apply the usual method to a modern star map.
Figure 3 illustrates a typical modern star map, showing the two arcs of circles, which cross near the center, labeled "Equator" and "Ecliptic". These circles are not always labeled, so it would be good to be familiar enough with the constellations to determine which is which. Just remember that the ecliptic is the stationary circle which always goes through the zodiac constellations.
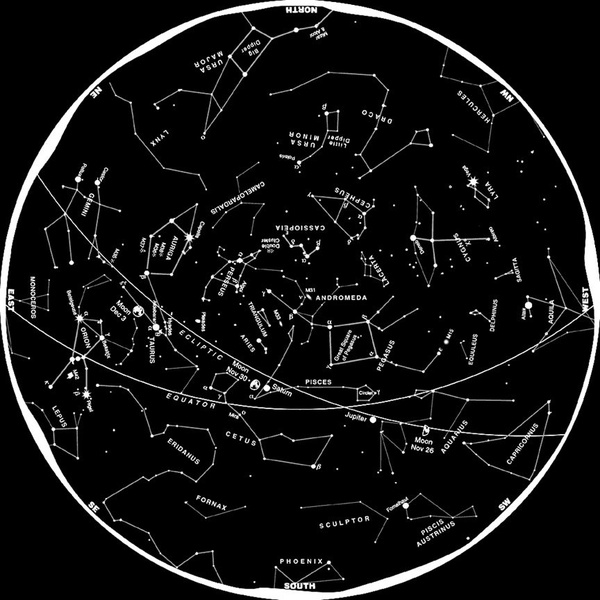 |
It's good to start out knowing that the spring equinox has been in Pisces for about 2,000 years and before that it was in Aries. In Figure 4 we see the crossing point near the end of Pisces and near Aquarius. This has everything to do with approaching the "Age of Aquarius" as that intersection point moves in that direction.
To determine the year of the map, it is now necessary to have some way of determining the position along the ecliptic of the vernal equinox as it slowly changes over the centuries. That is the purpose of Figure 4.
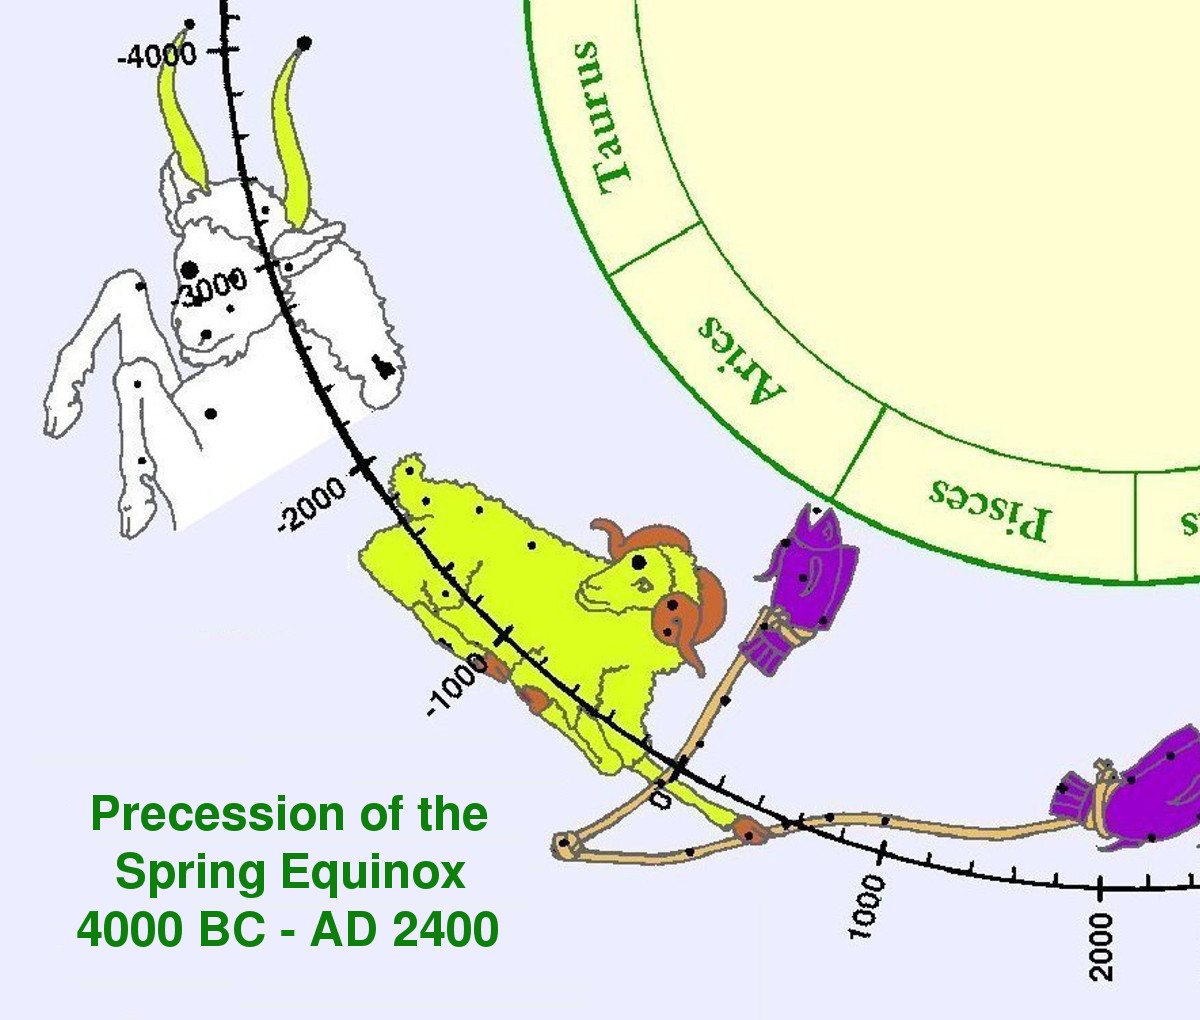 |
Figure 4 and the other similar scales in this article were produced from a star map that I commissioned an artist to draw from my own calculations of where all of the stars position are, using modern measurements. Thus, it is an actual star map and the figures were drawn according the the ancient Greek instructions of Ptolemy.
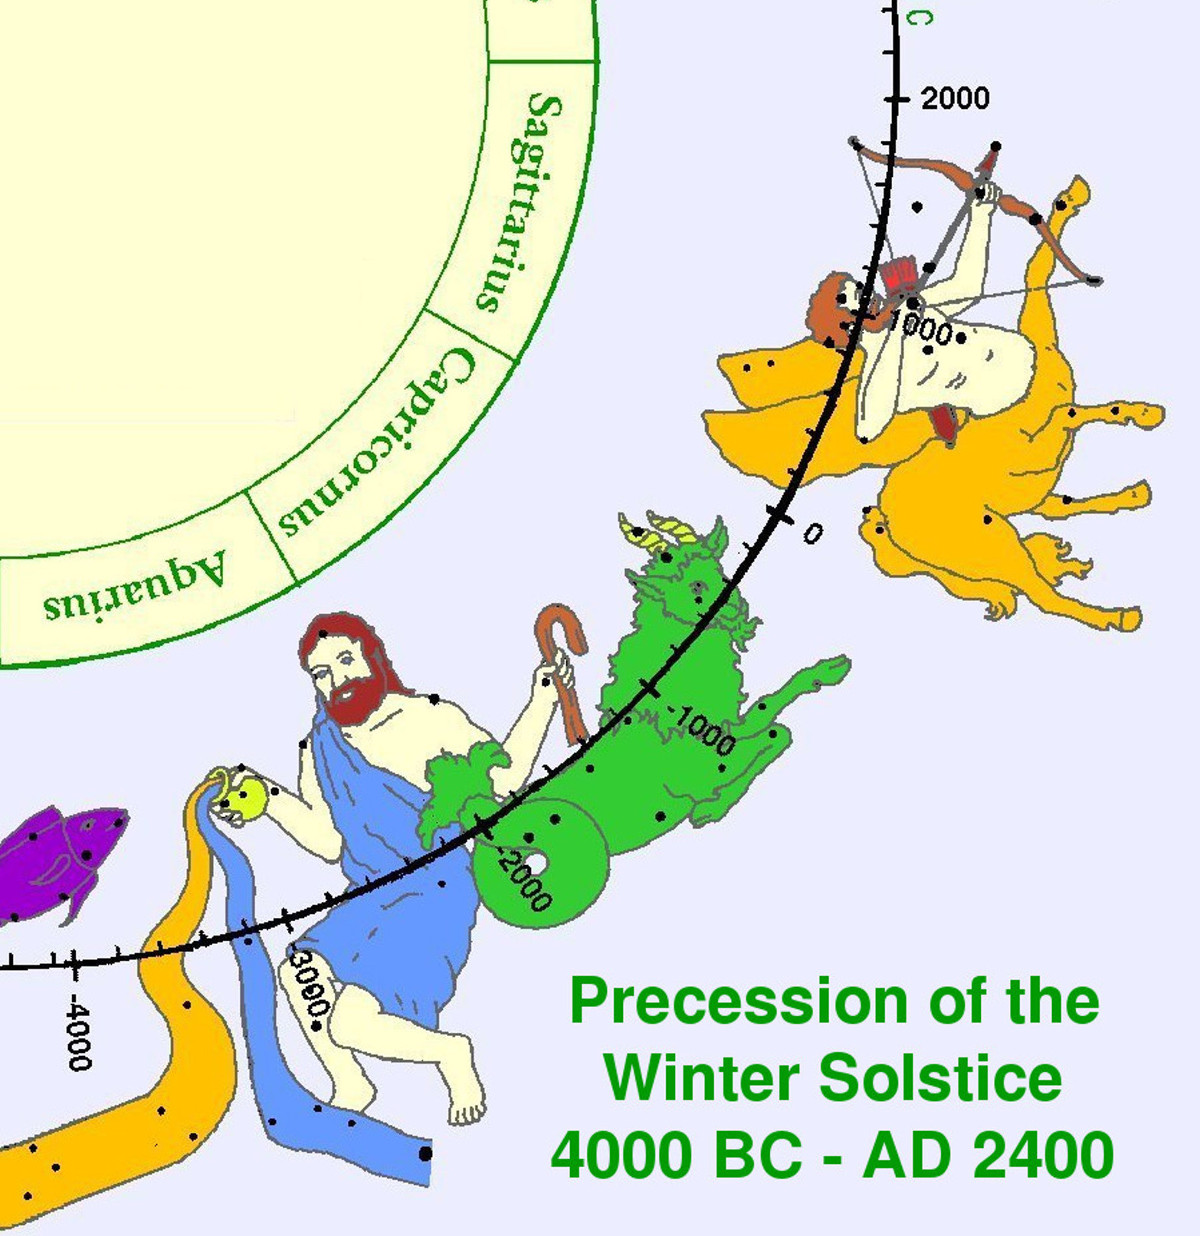
The scale with years marked on it in Figure 4 shows the position of the vernal equinox with 200 year tick marks from 4000 BC to AD 2400. Now all that is needed is to compare the position of the crossing arcs in Figure 3, attempting to identify the stars of the Western Fish, and then finding those stars in Figure 4 and estimating the date of the map to within 50 years if possible. Remember that the Figure 4 map show the stars drawn on imaginary longitude lines perpendicular to the ecliptic circle, so when you look at Figure 3, mentally draw a perpendicular line from a point in Pisces down to the ecliptic circle. Star map makers usually make new maps every 50 years because they center them on the moving circle rather than the stationary circle! Take a few minutes and estimate the date of this map. Is it 1950 or 2000?
Tick, tock, tick, tock, tick, tock, etc.
Okay, how did you do? What is your measurement? My answer is in footnote 3.[3]
You are now no longer an apprentice but have advanced to journeyman! (If you are even trying to read this article, you deserve to be on the fast track!) You are now ready to date a medieval star map with the colure averaging method!
Shortly after the printing press was invented in the late 1400s one of the first things printed was a star map by Albrect Dürer in 1515. A colored version of that map is shown in Figure 5. It is called a planishere because the stars on a sphere have been projected down into a flat circle (into the ecliptic plane).
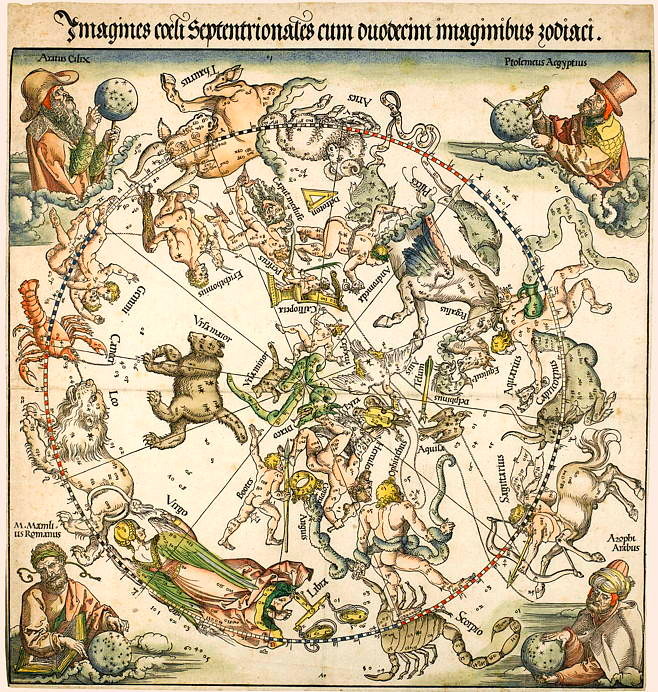 |
The large circle is the ecliptic, which is clear because it goes through all of the zodiac constellations and had the Dragon at the center. If the circle were the celestial equator then something else would be at the center, like our modern North Star (Polaris) at the end of the tail of the Little Bear. So the good news is that we have the ecliptic circle in the picture, but the bad news is that the celestial equator is not included.
We could guess that the divisions of the zodiac by twelve lines through the center point begin in the Ram and, if so, then that line would mark the vernal equinox. Rather than assume that, let us look at an update of this map in Figure 6.
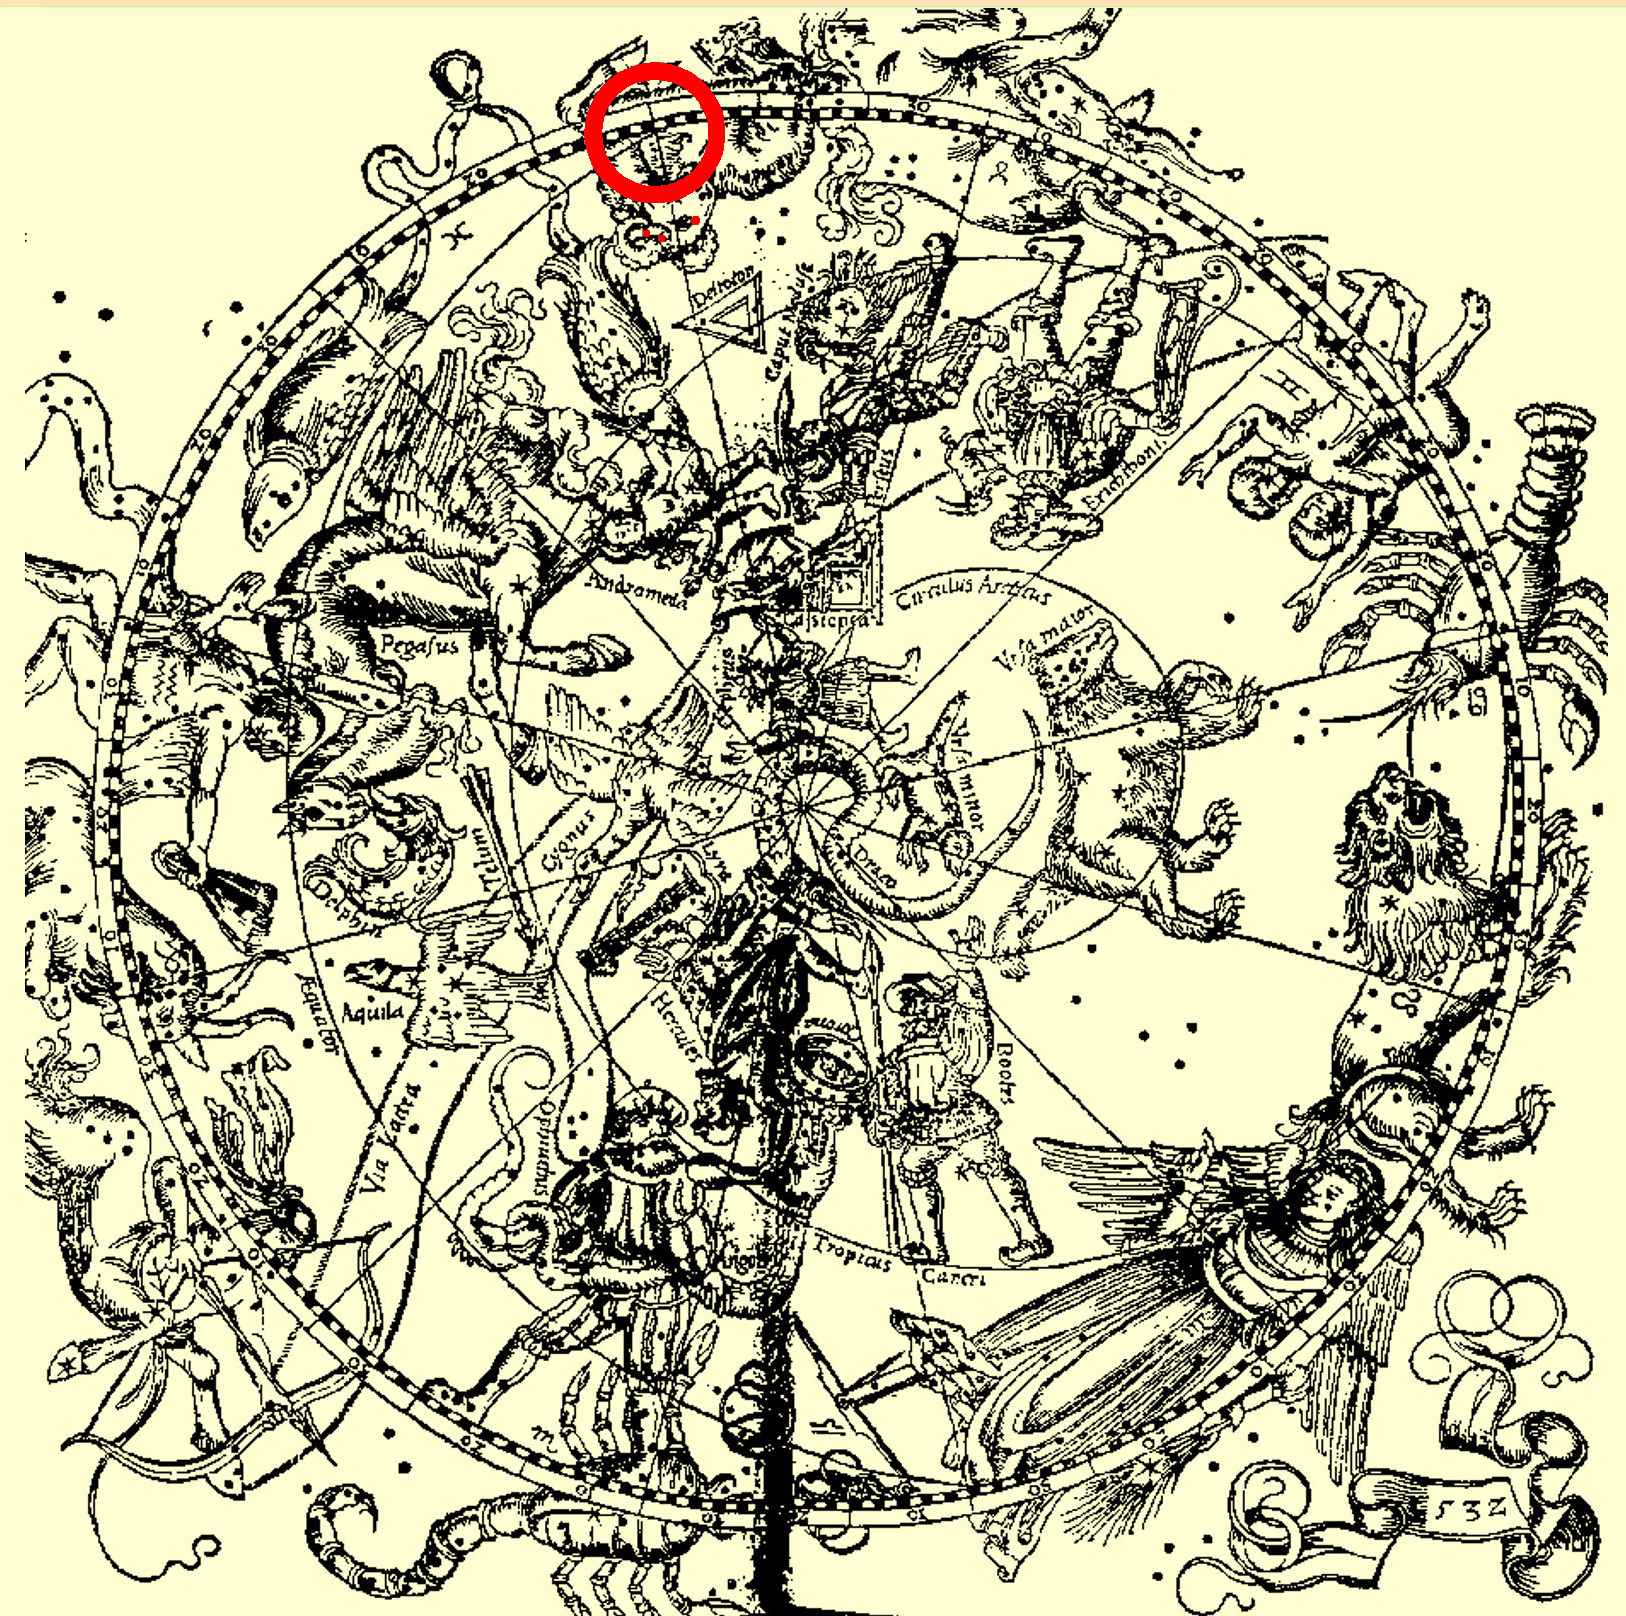 |
This 1532 version (the date is in the bottom right corner) has three improvements to Dürer's 1515 map. First, the figures were all reversed in the 1515 version, both the stars and the figures. Thus, they were all facing away from the viewer instead of toward him. That is done on celestial globes where the viewer is outside of the sphere, but the figures are meant to be viewed from the center of the sphere. So the constellations are correct in the 1532 version, in that they appear as they do in the sky. Other than that reflection, this map uses exactly the same star positions as did the 1515 map.
The second improvement is that properly updated modern (1532) fashion clothing has been added. And the third improvement is the one that makes the star map easy to date, because the celestial equator arc has been added also with several circles of celestial latitude.[4] The point of the vernal equinox, where the celestial equator crosses the ecliptic circle is now easy to find, especially with a red circle around it!
All that is now required to date the star map is the find the vernal equinox point on the scale in Figure 4 and read the date from the scale. Hint: to make it easier, because the three key stars in the Ram's head were partially obscured by the picture, I've put those three stars in red. If you are reading this on a phone you can expand the photo and see them better, if not, you should know the zero point line goes through the middle of those three stars. Okay, go ahead and date the map to within 50 years as was done in the last section.
Tick, tock, tick, tock, tick, tock, etc.
Again my answer is a footnote.[5] That answer is several hundred years BC, so many, in fact, that it is long before the Greeks who supposedly made the star position tables. There is a chance that the 1532 woodcut maker drew the circle at the wrong zodiac division line. If it was supposed to be at the next line 30° counterclockwise which runs through the back of the Western Fish of the Fishes (Pisces) rather than in Aries (the Ram), then the date would be 2,160 years later in AD 1560.[6] I suspect that is what happened, because the history is that Dürer's mathematician friend supposedly updated the star coordinates to be for their epoch.[7]
Look how powerful the method is already. It even allows one to find mistakes in the star map itself!
Now for the colure averaging improvement to the method of using both equinoxes and both solstices to do the dating.
Even though the spring equinox is traditionally used for dating a star map, the autumm equinox could have been used just as well. Figure 7 shows the time scale for the precession of the autumn equinox.
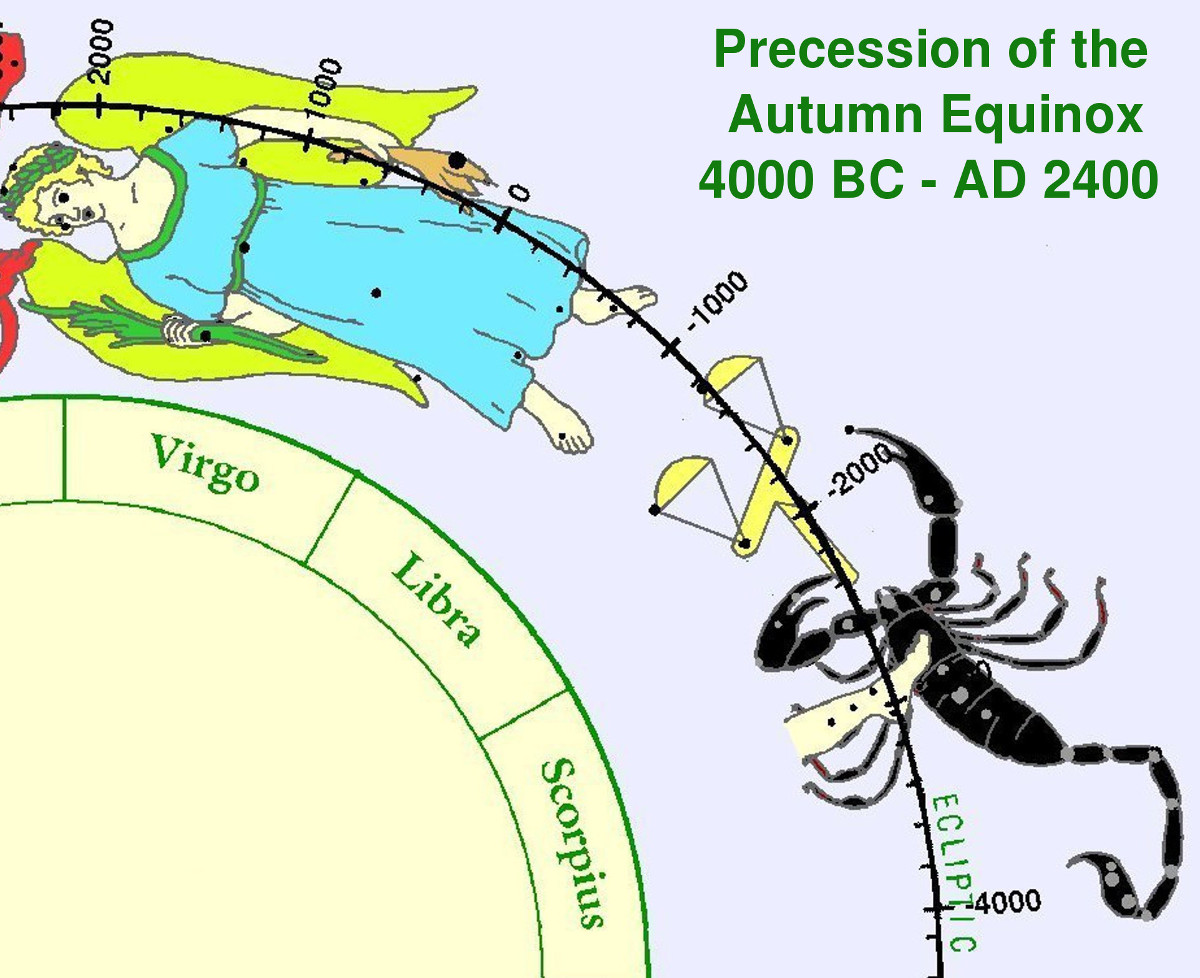 |
Look back at Figure 6 and follow the circle of the equator around until it intersects the ecliptic in the foot of the Maiden (Virgo) in the autumn equinox point. Then look for recognizable stars and compare their location to the scale in Figure 7.
This time it is harder to date because the star in her left foot (at 700 BC) is obscured by the scale itself and the stars in the hem of her dress (at 500 BC) are not clearly discernible. The dating would appear to be somewhere in the 700-500 BC time frame, close to 600 BC. This is an example of why it is convenient to have four options to date the star map. We were lucky that the stars of the Ram were clear and perfectly positioned to accurately date the map from the spring equinox, but not so for the autumn. But it could have been the other way around where the autumn equinox would have given the precise date.
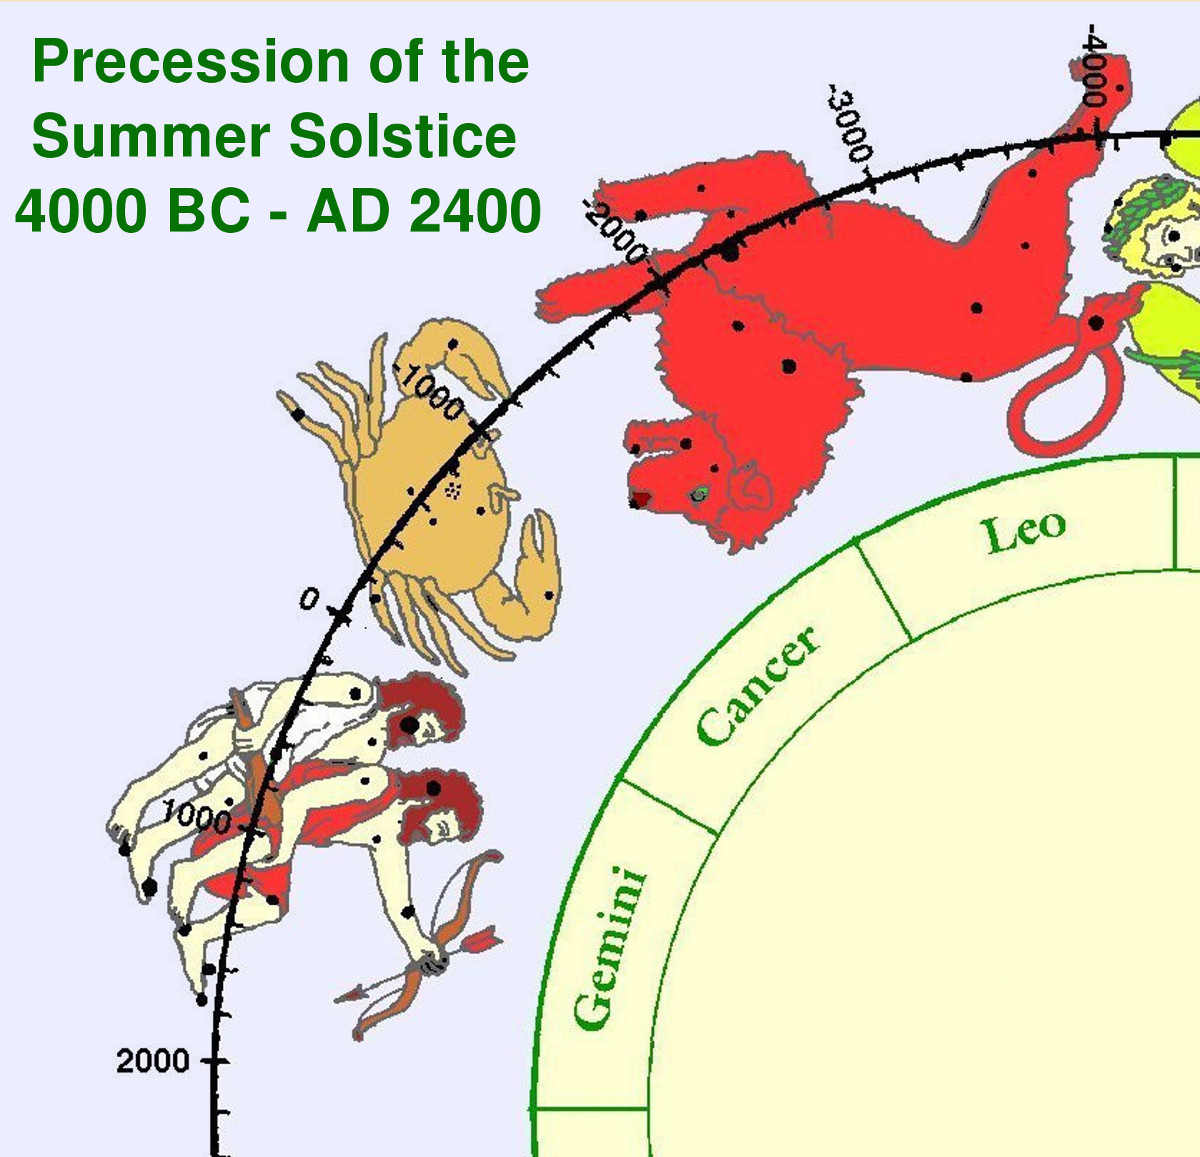
Now let's look at the other two colure points, the summer and winter solstices. Those points are exactly halfway between the spring and autumn equinoxes. Fortunately, there are longitude lines drawn there for us every 30°, which is common on many star maps. Find the summer solstice line intersection point in Figure 6 in the Crab (which looks like a crayfish) at about the 3 o'clock position. Keep in mind that the stars in this map are positioned very well, but the artist's picture may be somewhat off.
The 90° summer colure line points directly to a star! Look just above that star to the star slight above the ecliptic and one slightly below allows us to identify this star precisely as δ Cnc,[8] the star at the 800 BC point in Figure 8, which shows the scale for the precession of the summer solstice. Thus, we get another precise measurement which can be averaged with the first two.
 |
Now let's look at the last point, the winter solstice. Find the winter solstice line intersection point in Figure 6 in the Goat about the 9 o'clock position. Look for the two stars in the goat's right horn which are in a line perpendicular to the ecliptic circle. Now let's look at the winter solstice scale, shown in Figure 9.
 |
Notice that there are again two stars in the right horn perpendicular to the ecliptic circle. Those are two of the brightest stars in this rather dim constellation. On the scale they are at about 500 BC. The winter solstice line in the medieval map are about 100 years earlier, so this measurement indicates about 600 BC.
Averaging these four colure results of 600 BC from spring, 600 BC from autumn, 800 BC from summer and 600 BC from winter leads to the final result of 650 BC. That date is difficult to explain as really being from the Greek measurements. But, as suggested above, what if the maker of the 1532 guessed wrong at where the celestial equator circle should be and put it in the Ram rather than the Fishes. Then the true date of the map would have be 2,160 years after 650 BC. That would put the intended date of the star map to be AD 1510. Bingo! The history is that Dürer's mathematician friend updated the Greek measurements to be correct for their epoch and now it looks like he did a great job! It was the line in Pisces which was intended to be the vernal equinox! When someone else updated Dürer's map, they put the spring equinox, and hence all four of the colures, in the wrong places, all off by 30°!
Thus, we see how much information can be deduced from a star map! If you have followed everything so far, you are now a journeyman star map dater and ready for a new challenge!
Now let us turn to a tougher problem of dating a star map with no circles or lines at all, except for the circumference of the map!
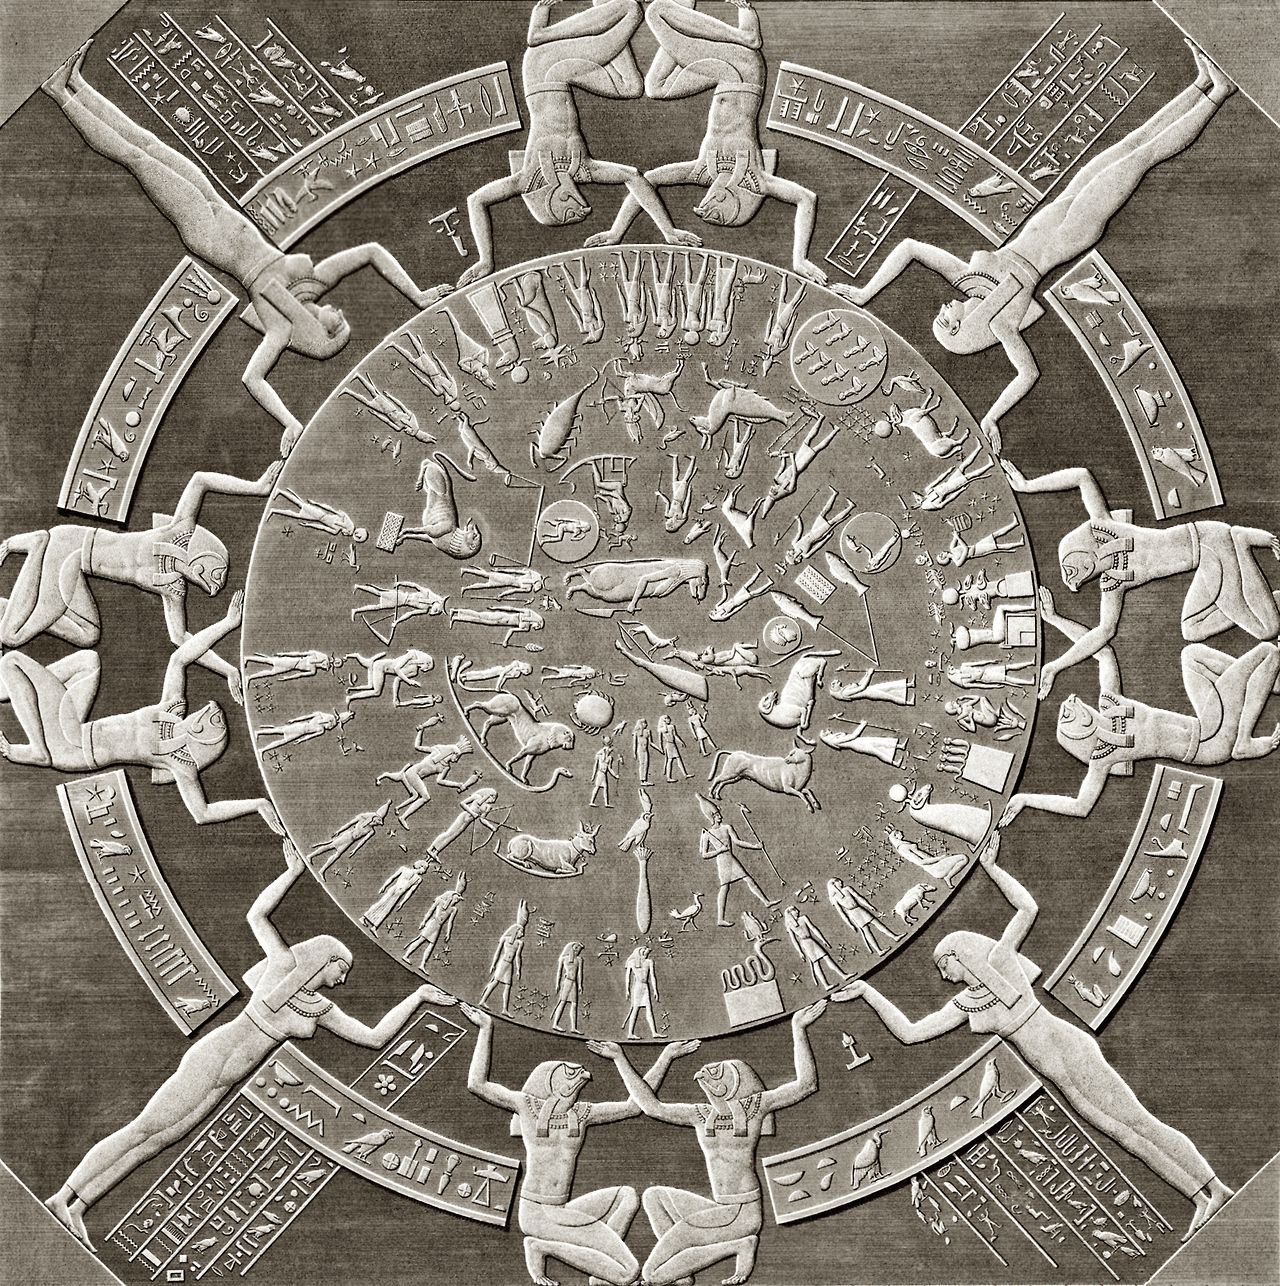
On the ceiling of the portico (front room or porch) of the Temple of Hathor in Dendera, Egypt, there was a star map which has since been relocated to the Louvre in Paris, France. It is shown in Figure 10.
 |
See if you can located all 12 constellations of the zodiac in that map.
Tick, tock, tick, tock, tick, tock, etc.
Did you find them all? Were they all in a circle? Did you notice anything unusual about them? Did the figures look like this was intended to be a precise star map as were the medieval maps?
The zodiac constellations look surprisingly like those of the Greeks amidst a lot of other Egyptian constellations. The Big Dipper is the thigh of a bull and the usual Dragon at the center is a Hippopotamus. So let us focus only on the zodiac constellations to date this map.
Looking more closely at the zodiac circle, it can be noted that the figures were shown as symbolic only, with little effort to place them in correct positions relative to the other figures. For example, the Ram is reversed; its foreleg is supposed to cross the bands holding the Fishes! The Bull is also reversed and shown as a full figure rather than front half only. Aquarius is also reversed, but correctly shows two streams which the Greeks had overlooked.
For our purposes, it is important to note that the zodiac figures are indeed in a circle which is not centered in the circle of the star map circumference. That tells us that the center of the map is the north celestial pole, not the north ecliptic pole. The offset of the zodiac circle from center can be used to date the map!
There has not been much known to me in the literature about the date of this zodiac except to assume that it dates to when the temple was built about 100 BC. There was one attempt to use the method described in this article. It was to simply draw both the ecliptic through the zodiac circle and also the equator and use their intersection at the vernal equinox to date the map. Figure 11 is taken from that effort.[9]
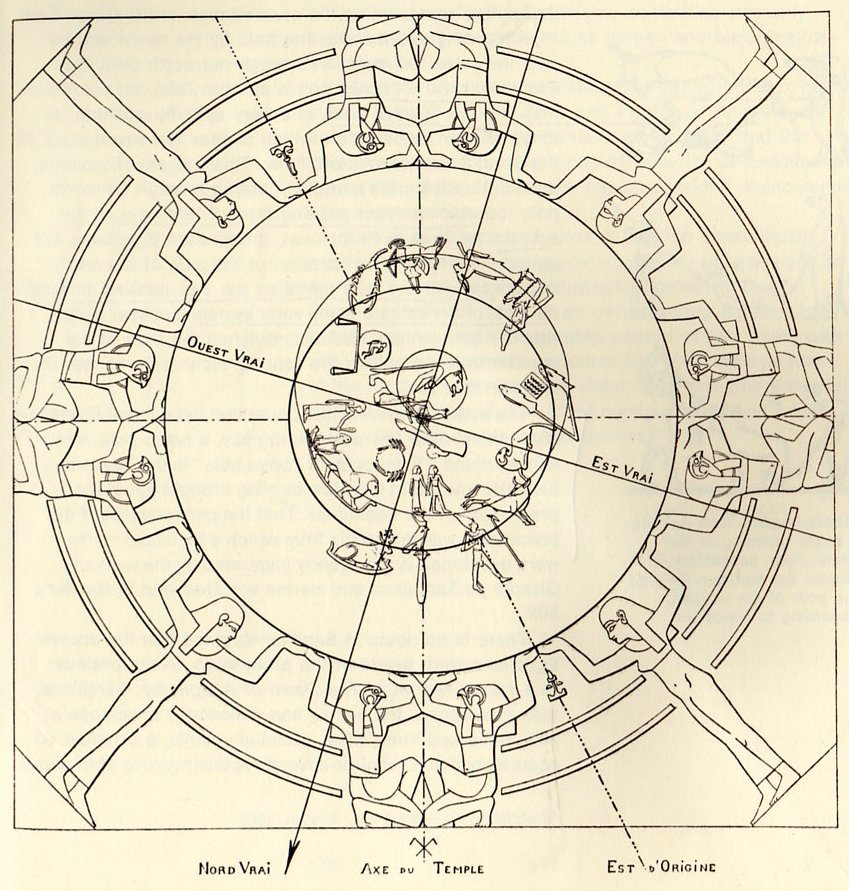 |
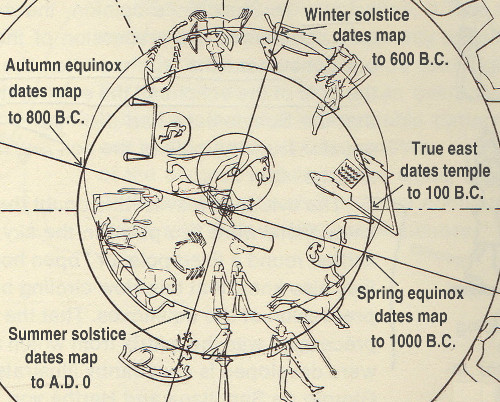
Let's not debate the accuracy of those circles which look good enough considering the rough placement of the figures. Let us simply apply the method of colure averaging to all four indicated values. It should also be noted that the dashed lines in Figure 11 parallel to the edges of the illustration indicate the orientation of the star map in the ceiling. It was suggested in the original work from which this illustration was taken that such is the case: the date by assuming the true vernal equinox at the time of building was true east indicates 100 BC. This indeed shows that the Egyptians at that time understood where the current spring equinox was.
 |
A new method of estimating the date of the positions of the stars in a star map is presented called the "colure averaging" method. The usual method is to just use the position of the spring equinox point to date the map by calculating when the position of the true spring equinox was at that point. Colure averaging simply averages such results taken at all four colure points: both spring and autumn equinoxes and summer and winter solstices.
After introducing the usual method as applied to a modern star map, colure averaging was applied to a 1532 medieval star map woodcut, leading to the conclusion that the colure circle of the equinoxes may have mistakenly been considered to be in the Ram rather than in the Fishes, leading to the celestial equator being offset 30°. Thus, even though the colure averaging method led to a date of 650 BC, the true intended date would have been 2,160 years later in AD 1510. The date of the original woodcut of Dürer was 1515, so that exercise was considered a success.
Finally, the Planisphere of Dendera was dated using colure averaging even though the map had apparently been made with a very liberal latitude in the actual placement of the figures. The result was 600 BC. The date of building the temple was about 100 BC as indicated by archeology and the planisphere itself. While the 600 BC may be one or two centuries off, it appears that the date of the star map long precedes the building of the temple.